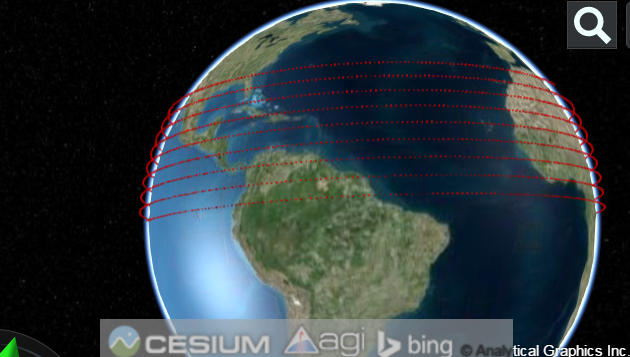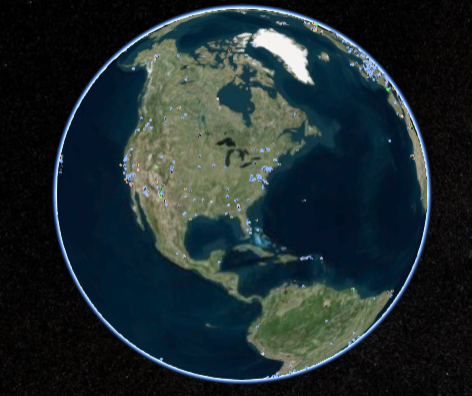
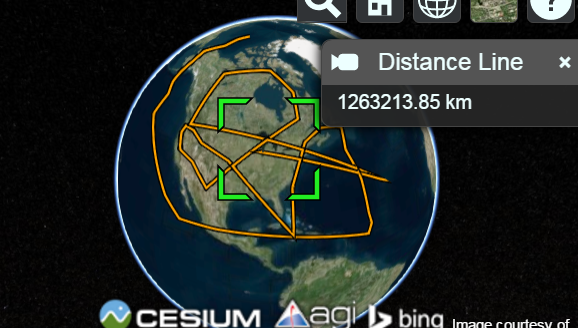
var viewer = new Cesium.Viewer('cesiumContainer'); var scene = viewer.scene; var ellipsoid = scene.globe.ellipsoid; var handler; // variables that support distance line var distPosCarte = []; var distPosCarto = []; var surfaceDist = 0; var distLine = viewer.entities.add({ id : 'distLine', name : 'Distance Line', polyline : { width : 3, positions : [], material : new Cesium.PolylineOutlineMaterialProperty({ color : Cesium.Color.ORANGE, outlineWidth : 2, outlineColor : Cesium.Color.BLACK }) } }); handler = new Cesium.ScreenSpaceEventHandler(scene.canvas); handler.setInputAction(function(movement) { // clear distPos arrays on single click without SHIFT distPosCarto.length = 0; distPosCarte.length = 0; surfaceDist = 0; }, Cesium.ScreenSpaceEventType.LEFT_CLICK); handler.setInputAction(function(movement) { var cartesian = viewer.camera.pickEllipsoid(movement.position, ellipsoid); if (cartesian) { distPosCarte.push(cartesian); var cartographic = ellipsoid.cartesianToCartographic(cartesian); distPosCarto.push(cartographic); if(distPosCarte.length >= 2) { var posArray = []; // Build array with all points for (var i = 0; i < distPosCarte.length; i++){ posArray.push(distPosCarte[i]); } // Calculate surface distance between each point for (var j = 1; j < distPosCarto.length; j++){ var geodesic = new Cesium.EllipsoidGeodesic(distPosCarto[j-1], distPosCarto[j]); surfaceDist += geodesic.surfaceDistance; } distLine.polyline.positions = posArray; distLine.description = ((surfaceDist)/1000).toFixed(2) + ' km'; viewer.selectedEntity = distLine; } } }, Cesium.ScreenSpaceEventType.LEFT_CLICK, Cesium.KeyboardEventModifier.SHIFT);
Cesiumjs – Draw line around the globe ?
var viewer = new Cesium.Viewer('cesiumContainer'); var scene = viewer.scene; var globe = scene.globe; globe.depthTestAgainstTerrain = true; var cesiumTerrainProviderHeightmaps = new Cesium.CesiumTerrainProvider({ url : '//assets.agi.com/stk-terrain/world', requestWaterMask: true, requestVertexNormals: true }); viewer.terrainProvider = cesiumTerrainProviderHeightmaps; for(var iLp=0; iLp<3000; iLp++ ) { scene.primitives.add(new Cesium.Primitive({ geometryInstances : new Cesium.GeometryInstance({ geometry : Cesium.BoxGeometry.fromDimensions({ vertexFormat : Cesium.PerInstanceColorAppearance.VERTEX_FORMAT, dimensions : new Cesium.Cartesian3(40000.0, 30000.0, 50000.0) }), modelMatrix : Cesium.Matrix4.multiplyByTranslation( Cesium.Transforms.eastNorthUpToFixedFrame(Cesium.Cartesian3.fromDegrees(-111.0+iLp, (iLp/100))), new Cesium.Cartesian3(0.0, 0.0, 250000), new Cesium.Matrix4()), attributes : { color : Cesium.ColorGeometryInstanceAttribute.fromColor(Cesium.Color.RED.withAlpha(0.5)) } }), appearance : new Cesium.PerInstanceColorAppearance({ closed: true }) })); }
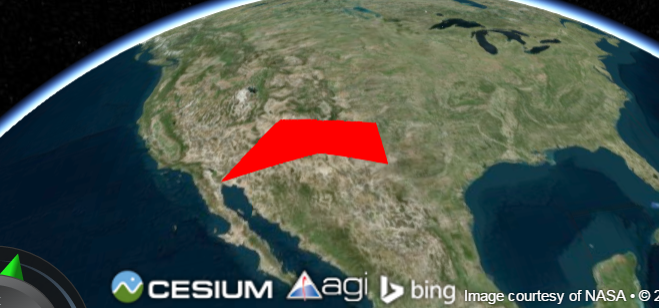
Cesium – How to changes the polygon positions on left click ?
var viewer = new Cesium.Viewer('cesiumContainer', { selectionIndicator : false, infoBox : false }); var scene = viewer.scene; var entity = viewer.entities.add({ polygon : { hierarchy : Cesium.Cartesian3.fromDegreesArray([-115.0, 37.0, -115.0, 32.0, -107.0, 33.0, -102.0, 31.0, -102.0, 35.0]), material : Cesium.Color.RED } }); var handler = new Cesium.ScreenSpaceEventHandler(scene.canvas); handler.setInputAction(function(click) { var pickedObject = scene.pick(click.position); if (Cesium.defined(pickedObject) && (pickedObject.id === entity)) { var positions = entity.polygon.hierarchy.getValue(viewer.clock.currentTime); positions[0] = Cesium.Cartesian3.fromDegrees(-110.0, 37.0); entity.polygon.hierarchy = positions; } }, Cesium.ScreenSpaceEventType.LEFT_CLICK);
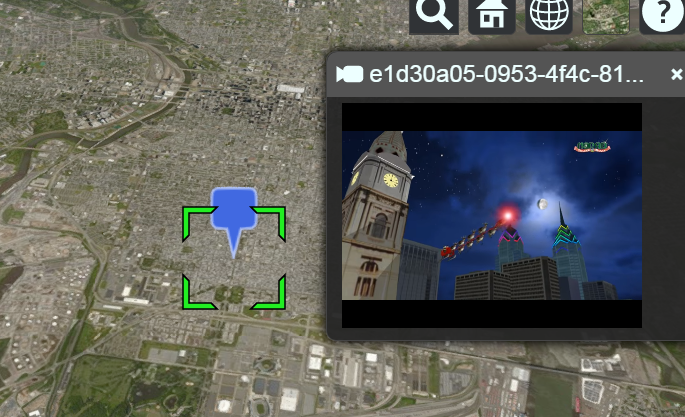
Cesium – How to add video in infobox ?
var viewer = new Cesium.Viewer('cesiumContainer'); var iframe = document.getElementsByClassName('cesium-infoBox-iframe')[0]; iframe.setAttribute('sandbox', 'allow-same-origin allow-scripts allow-popups allow-forms'); var pinBuilder = new Cesium.PinBuilder(); var bluePin = viewer.entities.add({ description: '', position : Cesium.Cartesian3.fromDegrees(-75.170726, 39.9208667), billboard : { image : pinBuilder.fromColor(Cesium.Color.ROYALBLUE, 48).toDataURL(), verticalOrigin : Cesium.VerticalOrigin.BOTTOM } }); viewer.zoomTo(bluePin);
Google Cloud Vision API
Google Cloud Platform Blog: Google Cloud Vision API changes the way applications understand
Have you ever wondered how Google Photos helps you find all your favorite dog photos? With today’s release of Google Cloud Vision API, developers can now build powerful applications that can see, and more importantly understand, the content of images. The uses of Cloud Vision API are game changing to developers of all types of applications and we are very excited to see what happens next!
Advances in machine learning, powered by platforms like TensorFlow, have enabled models that can learn and predict the content of an image. Our limited preview of Cloud Vision API encapsulates these sophisticated models as an easy-to-use REST API. Cloud Vision API quickly classifies images into thousands of categories (e.g., “boat”, “lion”, “Eiffel Tower”), detects faces with associated emotions, and recognizes printed words in many languages. With Cloud Vision API, you can build metadata on your image catalog, moderate offensive content, or enable new marketing scenarios through image sentiment analysis.
The following set of Google Cloud Vision API features can be applied in any combination on an image:
Label/Entity Detection picks out the dominant entity (e.g., a car, a cat) within an image, from a broad set of object categories. You can use the API to easily build metadata on your image catalog, enabling new scenarios like image based searches or recommendations.
Optical Character Recognition to retrieve text from an image. Cloud Vision API provides automatic language identification, and supports a wide variety of languages.
Safe Search Detection to detect inappropriate content within your image. Powered by Google SafeSearch, the feature enables you to easily moderate crowd-sourced content.
Facial Detection can detect when a face appears in photos, along with associated facial features such as eye, nose and mouth placement, and likelihood of over 8 attributes like joy and sorrow. We don’t support facial recognition and we don’t store facial detection information on any Google server.
Landmark Detection to identify popular natural and manmade structures, along with the associated latitude and longitude of the landmark.
Logo Detection to identify product logos within an image. Cloud Vision API returns the identified product brand logo, with the associated bounding polybox.
You can currently call the API by embedding an image as part of the request. In future phases, we will add support for integrating with Google Cloud Storage. The Vision API enables you to request one or more annotation types per image.
http://googlecloudplatform.blogspot.com/2015/12/Google-Cloud-Vision-API-changes-the-way-applications-understand-images.html
Cesiumjs – How to plot large KML data file ?
Matthew Amato –
For that many static points, you would have better luck using PointPrimitiveCollection directly. It doesn’t have all of the features of using the Entity API, but there is a lot less overhead. We want to support these use cases at the Entity/DataSource layer in the future (and will definitely support them in 3D Tiles), but it will require some significant refactoring.
——-
Matthew Amato –
Re: [cesium-dev] Re: KML big File size not working..
Sorry for taking a while to reply, but the answer here is a bit complicated and nuanced and I wanted to make sure I provided everyone with a good explanation.
The truth is, that the size of a KML is not a good metric for whether or not Cesium will be able to load the data, it’s what is in the KML that matters. Also keep in mind, that the size of a KML file means something very different than the size of a KMZ file. Since KMZ files are compressed and XML is so repetitive/compressible, a 1 meg KMZ file could easily be 20 megs of KML once decompressed. You can see this yourself by renaming .kmz to .zip and unzipping it.
For a real world example, Michael posted a 3.5 megabyte KMZ file that once decompressed is actually 59 megabytes of KML (which is about 1.3 million lines) containing around 154,000 placemarks. Cesium currently runs out of memory while trying to process this data.
So what does affect Cesium’s ability to load a KML/KMZ file? There are several things.
Most importantly right now is probably the number of placemarks. This is partially due to inefficiencies in Cesium and partially due to the nature of browsers (which I’ll discuss more of in a minute). For example, I’ve loaded KML files as large as 70 megs but with only ~20,000 highly detailed polygons total. Cesium can actually load this data without a problem (but it does take a few minutes). This is from my memory, I’ll see if I can dig up an actual file for better comparison.
The type of placemarks have an effect as well. For example, Polygons probably take longer to load, but you can load a lot more of them compared to Point geometry. You could probably get away with 30,000 polygons but you might choke on 30,000 markers.
The nature of JavaScript and the way browsers work is also a large part of the problem. First, JavaScript is simply slower than native languages, processing KML in the browser is never going to be as fast as processing in Google Earth, which is written in C++ but in time we may get close. Second, browsers enforce artificial memory limitations on individual web pages. While Google Earth is free to use as much memory as the operating system allows, web pages are usually only allowed between 800 and 1600 megs of RAM (but it depends on the browser). Third, JavaScript itself uses more memory to store the same amount of data compared to C++, so memory usage in a web app is naturally higher.
Another important thing to keep in mind is that there are a lot of crazy KML files out there than go out of their way to try and express data in a way Google Earth can understand. For example, Michael’s 60 megs of KML appear to create a simple outline of a tunnel. Cesium’s PolylineVolume can probably do the same thing instantaneously in a couple of lines of code. Since Google Earth doesn’t support polyline volumes, whomever created that KML file had no choice by to shoehorn the data into Google Earth in a way it could understand. (And even Google Earth starts to chug with that particular file) This is an important point to make, just because Cesium may have problems with the KML doesn’t mean Cesium can’t easily perform the same visualization that the KML represents. It may just require a different (and usually simpler) approach. Obviously this doesn’t help people with a library of KML files that they didn’t create themselves, but it’s still an important distinction.
My overall point is that there is no simple answer to “can Cesium handle this KML file?”
It’s not all doom and gloom though. As browsers and JavaScript continue to improve, I think we’ll see RAM usage come down and performance go up. There are also a lot of things we can do on the Cesium side of things to be more efficient about Entity visualization but these are fairly large changes and some of them may be breaking. It also requires a bit of experimentation and research. They will most likely be part of a much larger Cesium 2.0 effort which we currently don’t have a time-frame for. They will eventually happen because I want this as badly as you do, but it’s a matter of time and priority. We will continue to improve KML compatibility and performance when we can in the meantime.
As an aside, I strongly recommend anyone who can to use 64-bit Chrome, it will give you the best performance and allow the most memory usage of any of the browsers (as far as I am aware). A lot of people are using 32-bit Chrome and selling themselves short.
Finally, as someone already alluded to, the real solution is 3D Tiles. No matter how much we improve KML or Entity support, browsers and browser applications are simply a different beast than native and you need to have a different approach for visualizing massive datasets at scale. A lot of things that Google Earth can get away with by “brute forcing” are not possible in the browser because of JavaScript performance. Take the NYC demo. It currently includes 1,140,378 models. If you were doing this in Google Earth, that would take up about 10.3 GB of data on disc (the Collada files). Impossible to stream down for the web. Once we processed that into 3D tiles, we were down to 345 MB on disk broken up across 4,199 tiles. That’s smaller than most imagery sets. Normally when you batch files like this you end up with reduced interactivity, however with 3D tiles every one of these 1.1 million buildings is still selectable and has its own set of meta-data embedded with it. That level of selectability is something even Google Earth’s native building implementation struggles with. 3D Tiles support is in heavy development, but we are actively working on it and ultimately it will be able to handle everything KML can and more (such as point clouds).
Hopefully, that will answer any and all questions people have about KML loading performance, if not, please let me know and I’ll try to clarify further. Thanks.
How to convert KML color to HTML/RGB color code (KML to RGB conversion) ?
If you are KML user and you have to use KML defined color in html elements you need to use this.
function hex2rgb(value) { var color = "#" + value.substring(6, 8) + value.substring(4, 6) + value.substring(2, 4); return color; } var colour = hex2rgb("99FF11AA"); $(function() { $("#output").css("backgroundColor",colour); });
cesiumjs – How to get the positions of the polyline from a pick ?
var handler = new Cesium.ScreenSpaceEventHandler(viewer.scene.canvas); handler.setInputAction(function(click) { var pickedObject = viewer.scene.pick(click.position); if (Cesium.defined(pickedObject) && (pickedObject.id)) { console.log(pickedObject.id.polyline.positions.getValue(viewer.clock.currentTime)); } }, Cesium.ScreenSpaceEventType.LEFT_CLICK);
To set the positions to a new value, you can do
pickedObjects.id.polyline.positions = Cesium.Cartesain3.fromDegreesArray([lat, lon, lat, lon,...);
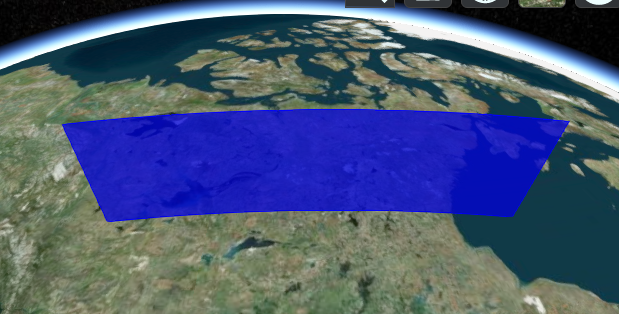
Cesiumjs – How to make Wall ?
var viewer = new Cesium.Viewer('cesiumContainer'); var blueCorridor = viewer.entities.add({ corridor : { positions : Cesium.Cartesian3.fromDegreesArray([ -120.0, 60.0, -90.0, 60.0 ]), extrudedHeight : 500000.0, width : 50.0, cornerType: Cesium.CornerType.BEVELED, material : Cesium.Color.BLUE.withAlpha(0.5), outline : true, outlineColor : Cesium.Color.BLUE } }); viewer.zoomTo(viewer.entities);